
Wonder why stock price trends are often estimated by looking at charts? Let us try to have a basic understanding about charts.
Simple reason why chart is very popular in stocks trading is that stock market produces large amount of data every second, every minute and it is utmost important to have a condense view of this large information quickly so that traders take their decisions (such as buy/sell/hold/enter/exit) based on a scientific analysis.
Charts help analyst with its following features normally:
- Data Distribution – Distribute the data categories into multiple possible frequencies – seconds, minutes, daily, weekly, monthly etc.
- Rapid Visualization – Summarize and present the large set of data into visuals for easy and quick understanding of data patterns.
- Past and Future Trends – Specifications about the data-trend thereby allowing analyst to estimate the future trend
- Simulation – Possibility to see simulated values for the ease of decision-making
- Use of symbols – Symbols such as bars (for bar-charts), line (for line-charts), pies/slices (for pie-charts), candles (for candle-stick charts) helps better visualization.
- Comparison of various data sets – Comparative analysis becomes easy when data is distributed/understood more logically.
- Switch chart-views – Once data is perfectly captured, it is easy for an analyst to view multiple type of charts
- Support & Resistance levels – Finding most probable support and resistance levels for index/stock.
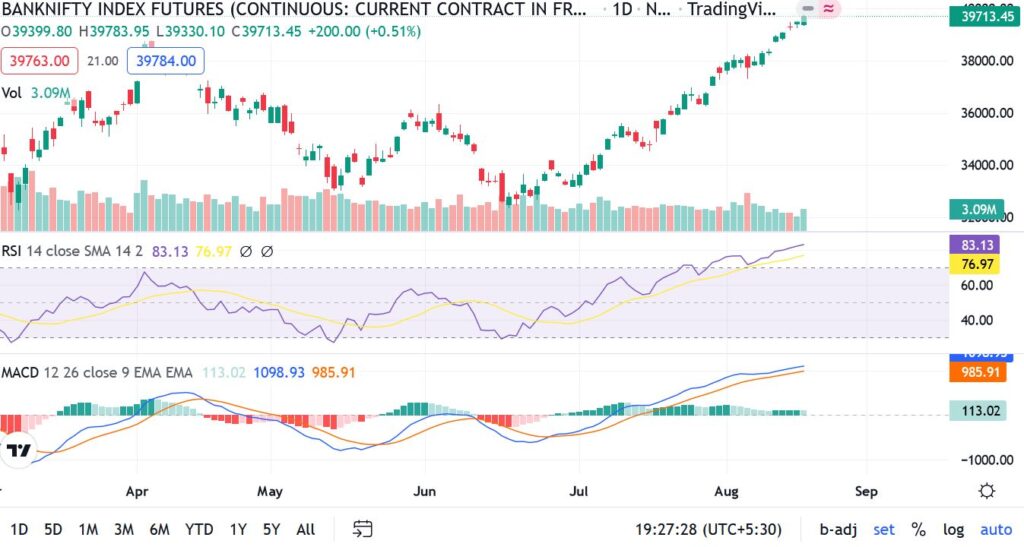
Though stock analysts use a variety of technical indicators using charts so that they can prepare good estimates about price movements that is most probable in given point of time, RSI (Relative Strength Indicator), MACD (Moving-Average Convergence/Divergence), Trend Analysis etc. are some popular indicators which are most commonly used by stock-market traders or analysts.
Use of technical charts and indicators offer no guarantee of 100% success even when an expert and well-experienced analyst perform analysis but this technique can definitely help to turn the maximum odds into favor. Under this section in upcoming posts, we will focus on the data of “Bank Nifty” to understand basic or key factors about Charts and gradually attempt to apply this understanding to best estimate the future trend of “Bank Nifty”.